Port Area Calculation Guide - Speaker Box Lite Workflow

Learn the iterative pipeline for selecting the ideal port area in Speaker Box Lite. Discover how to balance air velocity, pipe resonances, and enclosure volume for professional subwoofer performance.

Optimizing Port Area: The Iterative Pipeline for Subwoofer Design

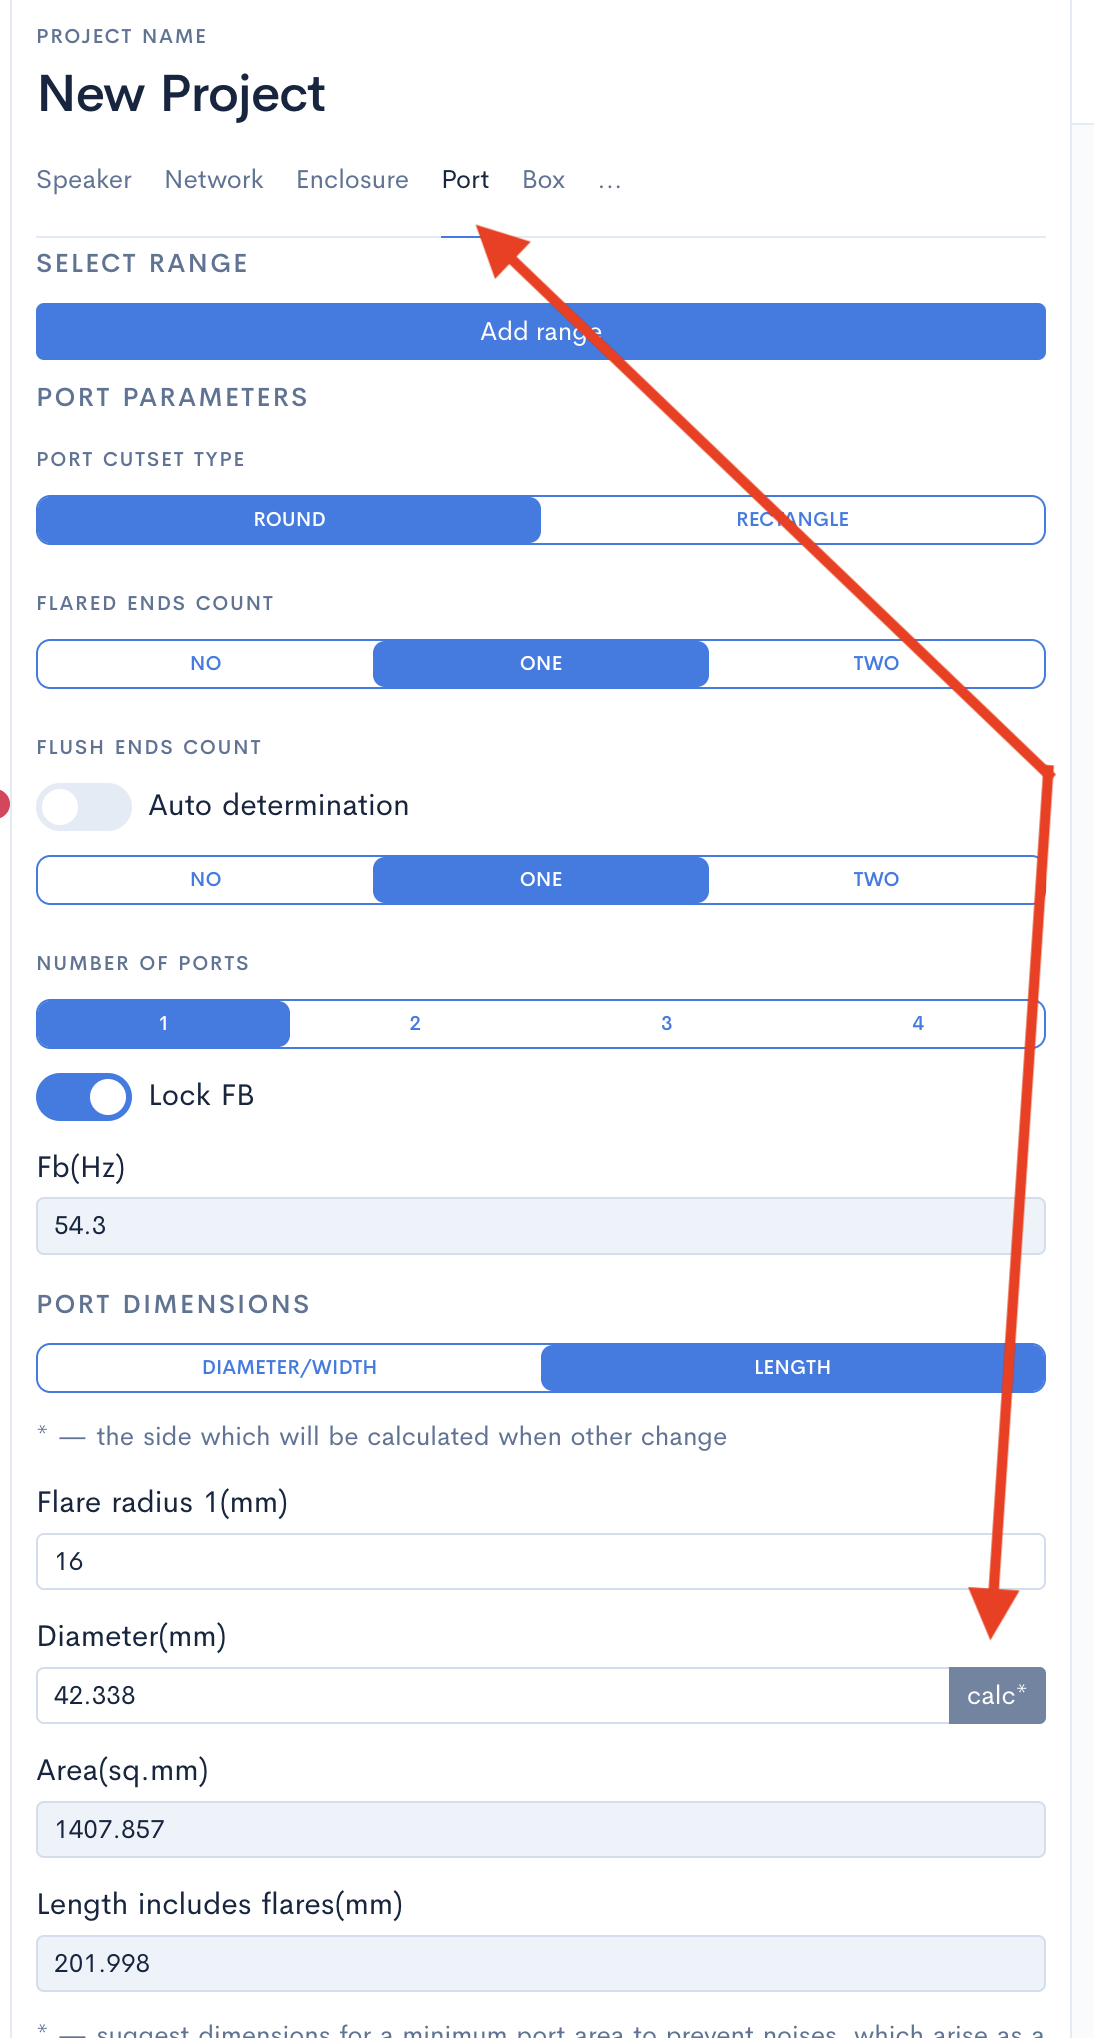
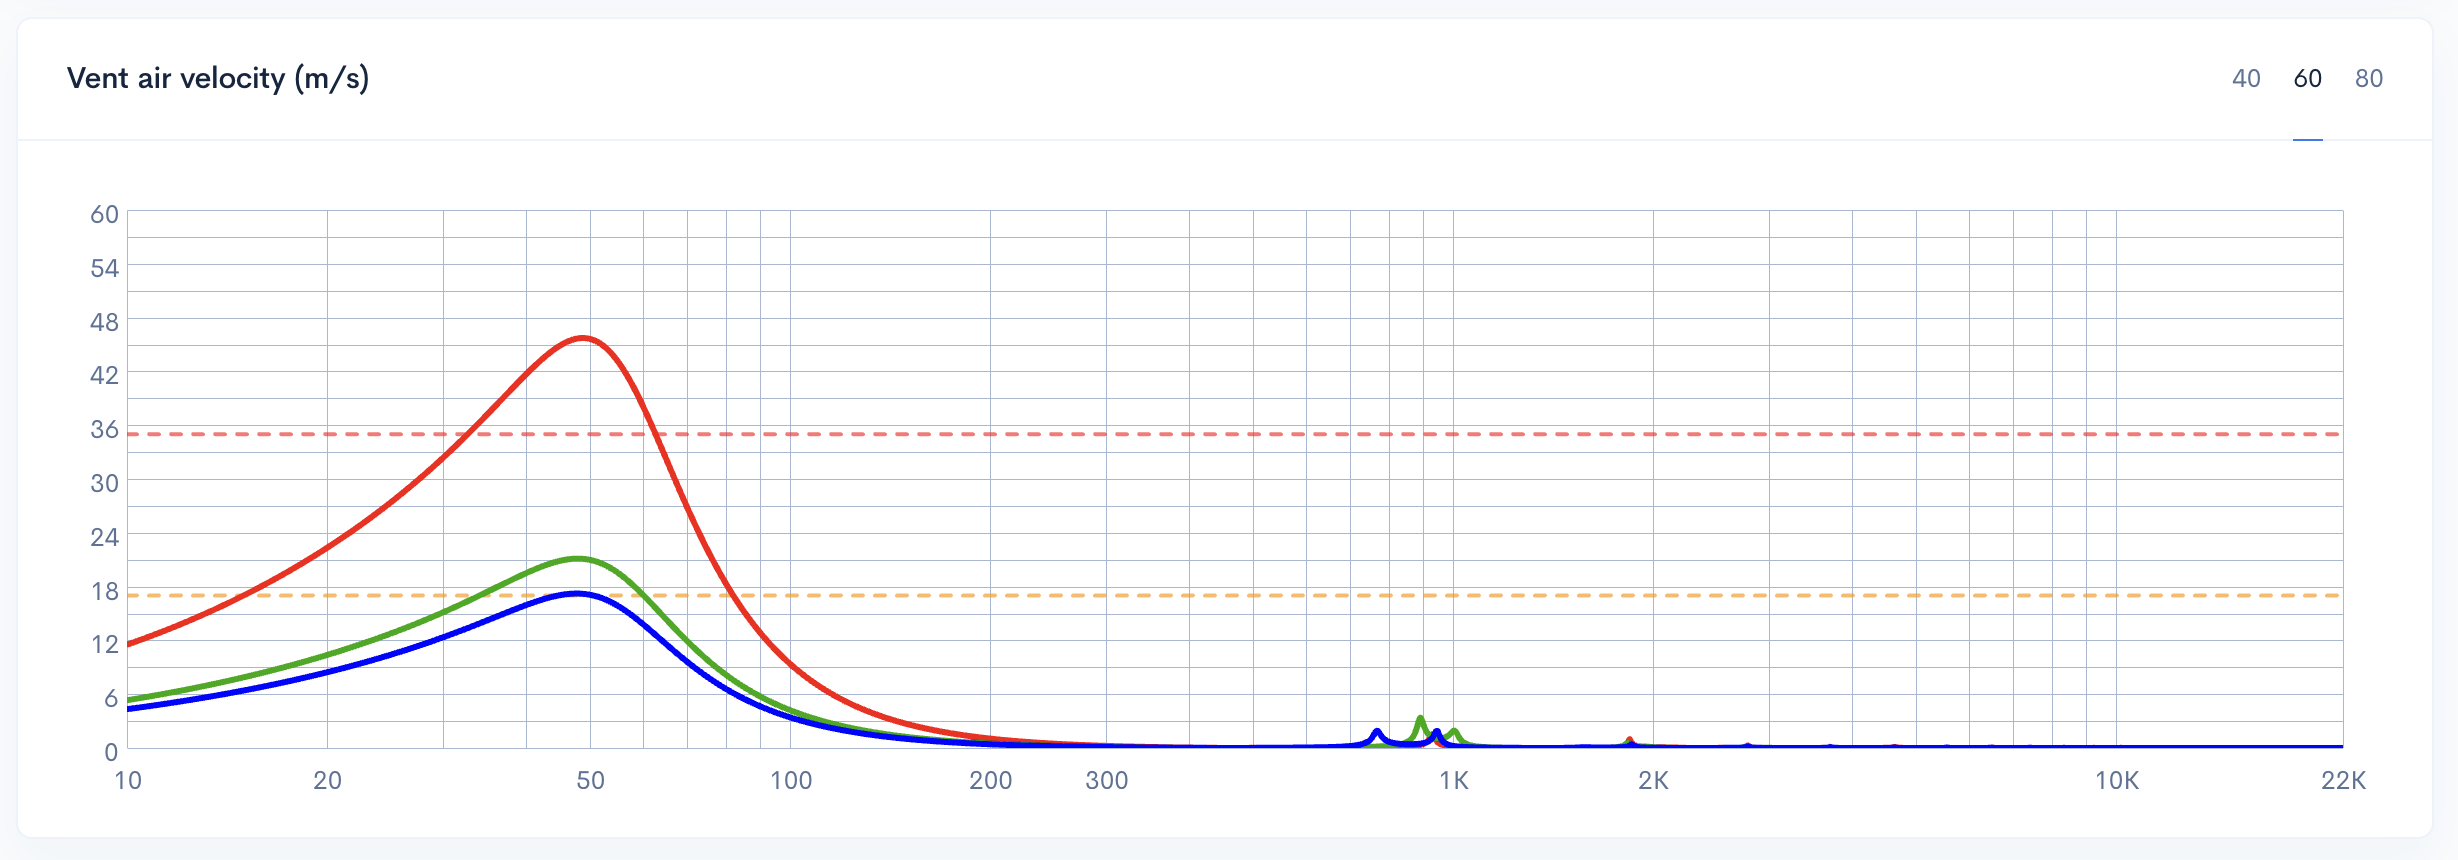
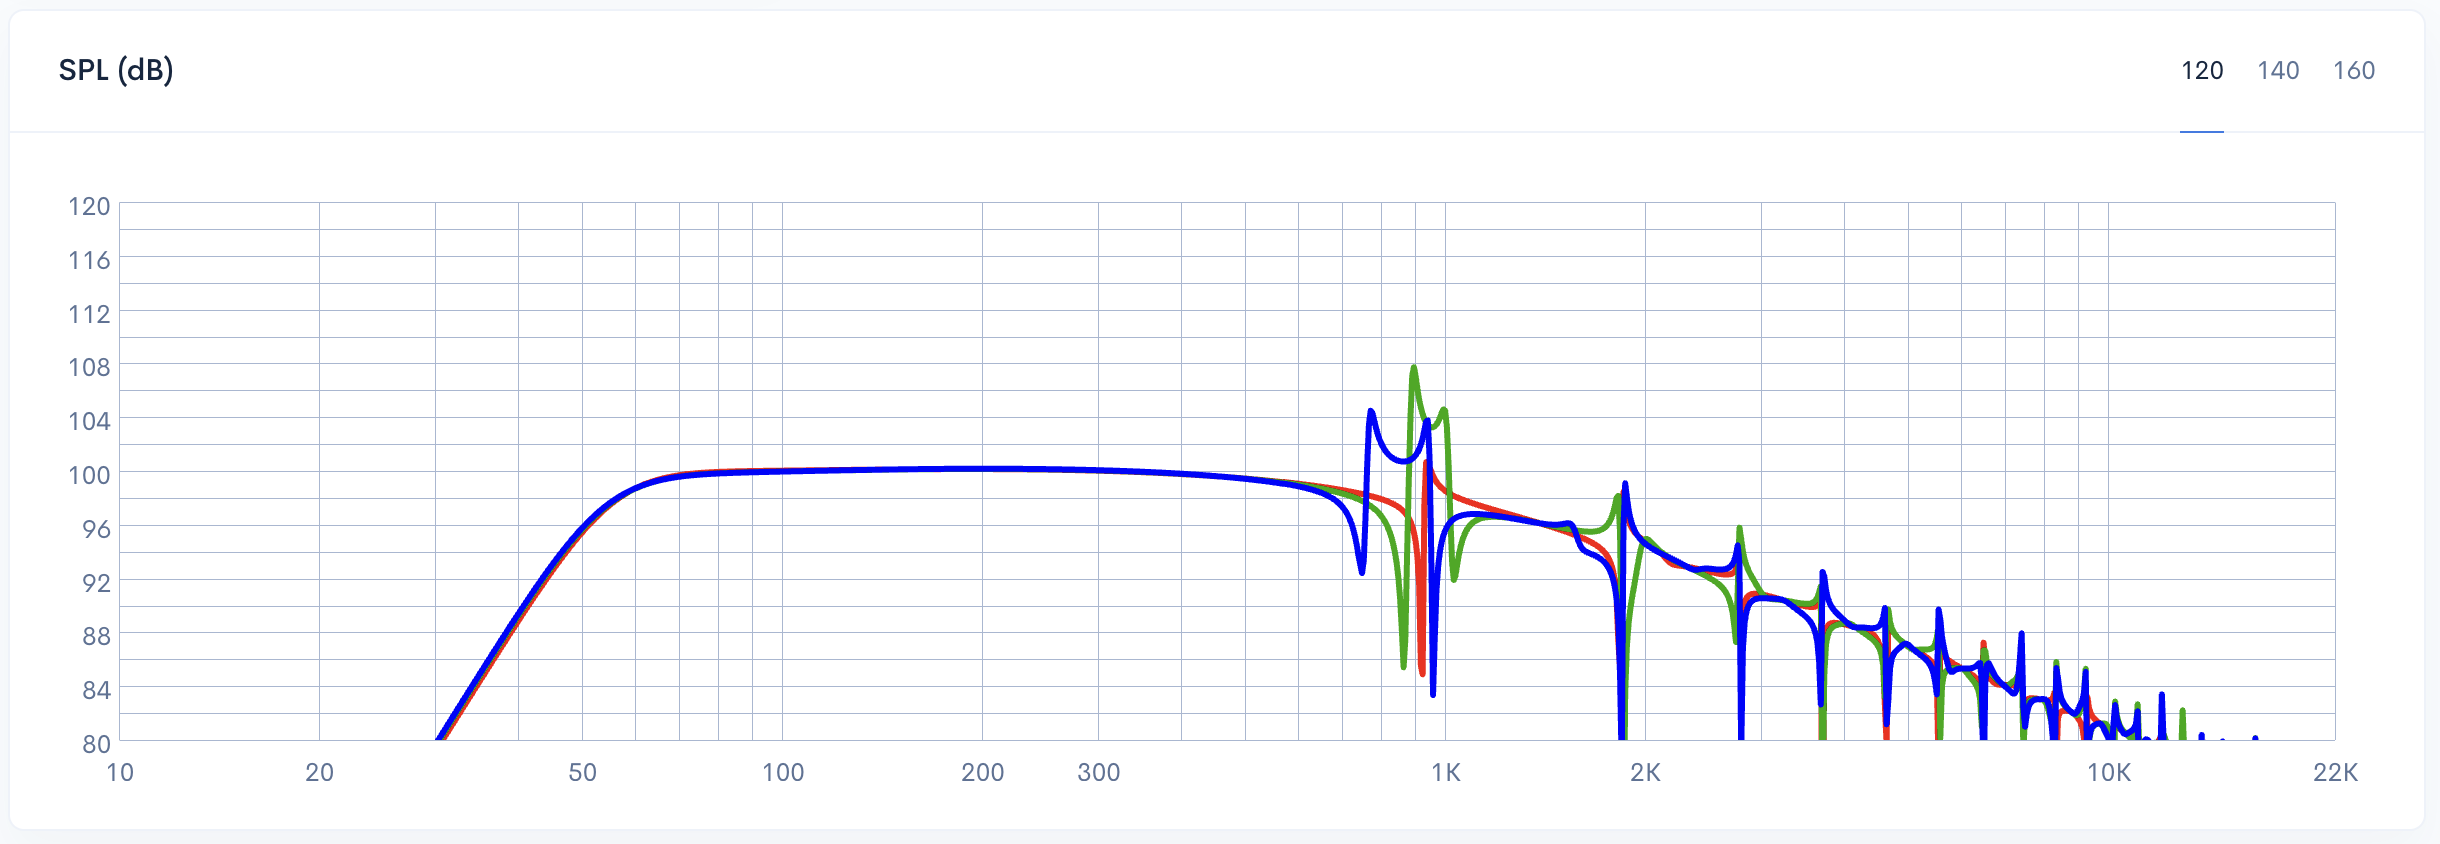
Designing a high-performance subwoofer enclosure requires more than just calculating the internal volume. One of the most critical, yet often misunderstood, components is the port. The port area is a dynamic variable that directly impacts the balance between acoustic efficiency and air turbulence. If the area is too small, you encounter "chuffing" - audible air noise that ruins the listening experience. If it is too large, the physical length of the port may become unmanageable, eating into the internal volume and introducing unwanted resonances.

Finding the "sweet spot" is rarely a one-step process. In Speaker Box Lite, port calculation is treated as an iterative pipeline rather than a static formula. By leveraging real-time simulations, designers can evaluate how different surface areas affect airflow and frequency response. The goal of this workflow is to find a configuration that maximizes output while keeping air velocity within safe limits. This guide will walk you through using Speaker Box Lite's visual tools to refine your port dimensions, ensuring your build achieves professional-grade clarity and power.

The Speaker Box Lite Port Calculation Pipeline

The Speaker Box Lite pipeline moves beyond simple frequency tuning. It is a multi-step workflow where you balance three conflicting factors: physical dimensions, acoustic performance, and air velocity limits. Simply hitting a target frequency is not enough - you must ensure the port fits the enclosure without causing chuffing or pipe resonances. The process starts by selecting an initial area preset and then refining it through iterative analysis. By checking the Vent Air Speed and Transfer graphs, you can see exactly how changes in area affect the air's behavior and the system's overall acoustic response.

Selecting Initial Port Area Presets

To use this feature, you must specify the driver's VD (displacement volume) or its Xmax and SD.

Speaker Box Lite simplifies the starting phase by offering four distinct presets: Noises, Less noises, Less quality, and Quality. These options represent different points on the velocity-to-size spectrum. The 'Quality' preset prioritizes low air velocity to eliminate chuffing, requiring a larger area and a longer physical footprint. Conversely, the 'Noises' setting allows for a more compact design by permitting higher air velocities. Selecting a preset is the first step in the pipeline - it provides the baseline logic for the calculation engine to balance acoustic purity against available enclosure volume.

To access these configuration presets, navigate to the Port tab as shown in the screenshots below.


Speaker Box Lite Port tab interface for initial area preset selection
Port area preset selection for air velocity and noise level management

Analyzing Vent Air Speed Graphs

The Vent Air Speed graph is a critical diagnostic tool that visualizes the velocity of air moving through the port at the driver's maximum excursion. This simulation calculates the peak air speed across the frequency range, specifically focusing on the area around the tuning frequency where port activity is at its highest. To generate accurate results, ensure you have provided the speaker's Xmax and Sd values. If the velocity exceeds specific thresholds - typically between 17 and 25 m/s - the air becomes turbulent, resulting in audible chuffing noises and reduced output. This graph identifies exactly where these aerodynamic bottlenecks occur.

The Two Boundary Guidelines

In Speaker Box Lite, the Vent Air Speed graph features two horizontal guidelines at 17 m/s and 26 m/s. These serve as visual boundaries for air velocity safety. The region below 17 m/s represents the optimal zone, ensuring clean, noise-free performance. The middle range, between 17 and 26 m/s, is a moderate territory where port noise may become audible under high load. Exceeding the 26 m/s limit enters the 'bad' zone, leading to significant turbulence and chuffing. Your objective is to iteratively adjust the port area until the plot stays within these safe bounds.

It is important to specify the power you will use in the Input power field before analysis.

The screenshots below illustrate Vent-air velocity graphs for port diameters of 26 mm, 38 mm, and 42 mm. As you compare them, observe how increasing the diameter lowers air velocity while requiring a significantly longer port to maintain the same tuning frequency - a fundamental trade-off between airflow quality and internal cabinet space.


Vent air velocity comparison for 26 mm (red), 38 mm (green), and 42 mm (blue) port diameters. Also, graph showing turbulence thresholds at 17 m/s and 26 m/s
Physical length for 42 mm diameter port
Physical length for 38 mm diameter port
Physical length for 26 mm diameter port

Evaluating the Transfer Graph and Resonance Influence

While air speed is critical for preventing turbulence, the physical dimensions of the port - specifically its length - introduce secondary acoustic effects visible on the Transfer Function graph. Every port acts as an organ pipe, creating standing waves at specific frequencies. As you increase the port area to lower air velocity, the required length must also increase to maintain the same tuning frequency (Fb).

This added length lowers the frequency of the first port resonance. On the Speaker Box Lite Transfer graph, these resonances appear as unintended peaks or ripples in the upper frequency range. If a port is too long, these resonances can shift down into the subwoofer's operating range, coloring the sound and reducing overall clarity. Monitoring the Transfer graph allows you to see if your chosen port dimensions are causing significant peaks that might interfere with your crossover point.

Achieving the perfect design requires balancing the port's cross-sectional area against these resonance peaks. The goal is to ensure the pipe stays short enough to keep unwanted harmonics well above the intended passband, providing a clean response that integrates smoothly with your main speakers.

Resonances on the Transfer graph are only available for the Complex model.

The screenshot below illustrates the transfer functions for the 26 mm, 38 mm, and 42 mm port diameters from the Vent Air Speed example above. As you can see, the blue graph with the maximum port area has the lower-frequency starting point for resonance peaks.

Transfer function comparison for 26 mm, 38 mm, and 42 mm port diameters showing resonance peaks

Step-by-Step: The Iterative Calculation Workflow

Designing the ideal port is rarely a single-step process. Instead, it requires a systematic approach where each adjustment is verified against acoustic and physical constraints. By following this iterative pipeline within Speaker Box Lite, you can balance performance with practical build limits.

  1. Start with a baseline: Begin by selecting a standard port area based on your driver size using the software's built-in presets. This provides a safe, mathematically sound starting point for the initial calculation.
  2. Analyze Vent Air Speed: Input your amplifier's maximum power level into the simulation. Check the Vent Air Speed graph to see if the air velocity crosses the recommended red guidelines, which would indicate potential turbulence.
  3. Scale for Turbulence: If the air speed is too high, increase the port's cross-sectional area. This reduces the velocity at the vent opening, effectively eliminating audible "chuffing" noises.
  4. Verify Resonances: Because a larger area requires a longer port to maintain the same tuning frequency, you must check the Transfer graph. Ensure the resulting pipe resonances - the organ pipe effect - remain well above your intended low-pass crossover frequency.
  5. Compensate for Displacement: A larger, longer port occupies more internal space. Adjust the enclosure’s total volume to account for this increased port displacement, ensuring the net internal volume remains consistent with your design goals.
  6. Refine and Repeat: Continue this cycle until you reach a configuration where air speed is controlled, resonances are out of the operating range, and the port physical dimensions still fit within your cabinet.

This workflow ensures that every adjustment to the port area is checked against all relevant performance metrics, resulting in a cleaner, more efficient subwoofer build that avoids common design pitfalls.

The Fundamental Port Area Trade-Off

Selecting the right port area is a fundamental trade-off between aerodynamic stability and physical practicality. On one side of the scale, a port area that is too small forces air to move at high velocities. When this velocity exceeds specific limits, laminar flow breaks down into turbulence, resulting in audible "chuffing" - or port noise - that ruins the listening experience.

Conversely, increasing the port area to reduce velocity introduces a different set of challenges. To maintain the same tuning frequency with a larger cross-section, the port's physical length must increase significantly. This extra length consumes valuable internal enclosure volume, effectively reducing the net space available for the driver. Furthermore, longer ports result in lower pipe resonances. If the port becomes too long, these resonances can drop into the audible frequency range, creating unwanted peaks in the Transfer graph. The designer's goal is to find the "sweet spot" where air speed is controlled without compromising enclosure volume or acoustic purity.

Conclusion: Choosing the Right Port Area for Your Build

Ultimately, there is no such thing as a "perfect" port - only the right one for your specific project. Every design involves balancing physical constraints against acoustic performance. By utilizing the visual tools in Speaker Box Lite, such as the Vent air speed guidelines and the Transfer graph resonance peaks, you can navigate these trade-offs with precision. Use the iterative pipeline to find that ideal sweet spot where port noise is eliminated without sacrificing enclosure volume or creating unwanted resonances. Trust the data, monitor the graphs, and choose the configuration that best serves your specific application.


Bagikan: